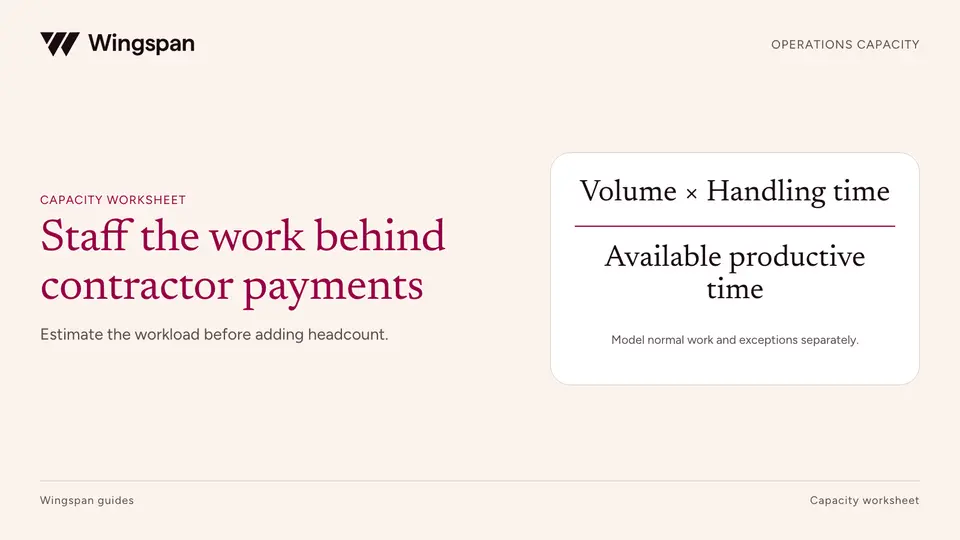
How to staff contractor operations as your network grows
Forecast the internal team capacity required for contractor onboarding, payment exceptions, support, and tax readiness across normal, peak, and growth scenarios.
A decision model for estimating contractor replacement resources and service capacity lost during a departure, with explicit demand and coverage assumptions.
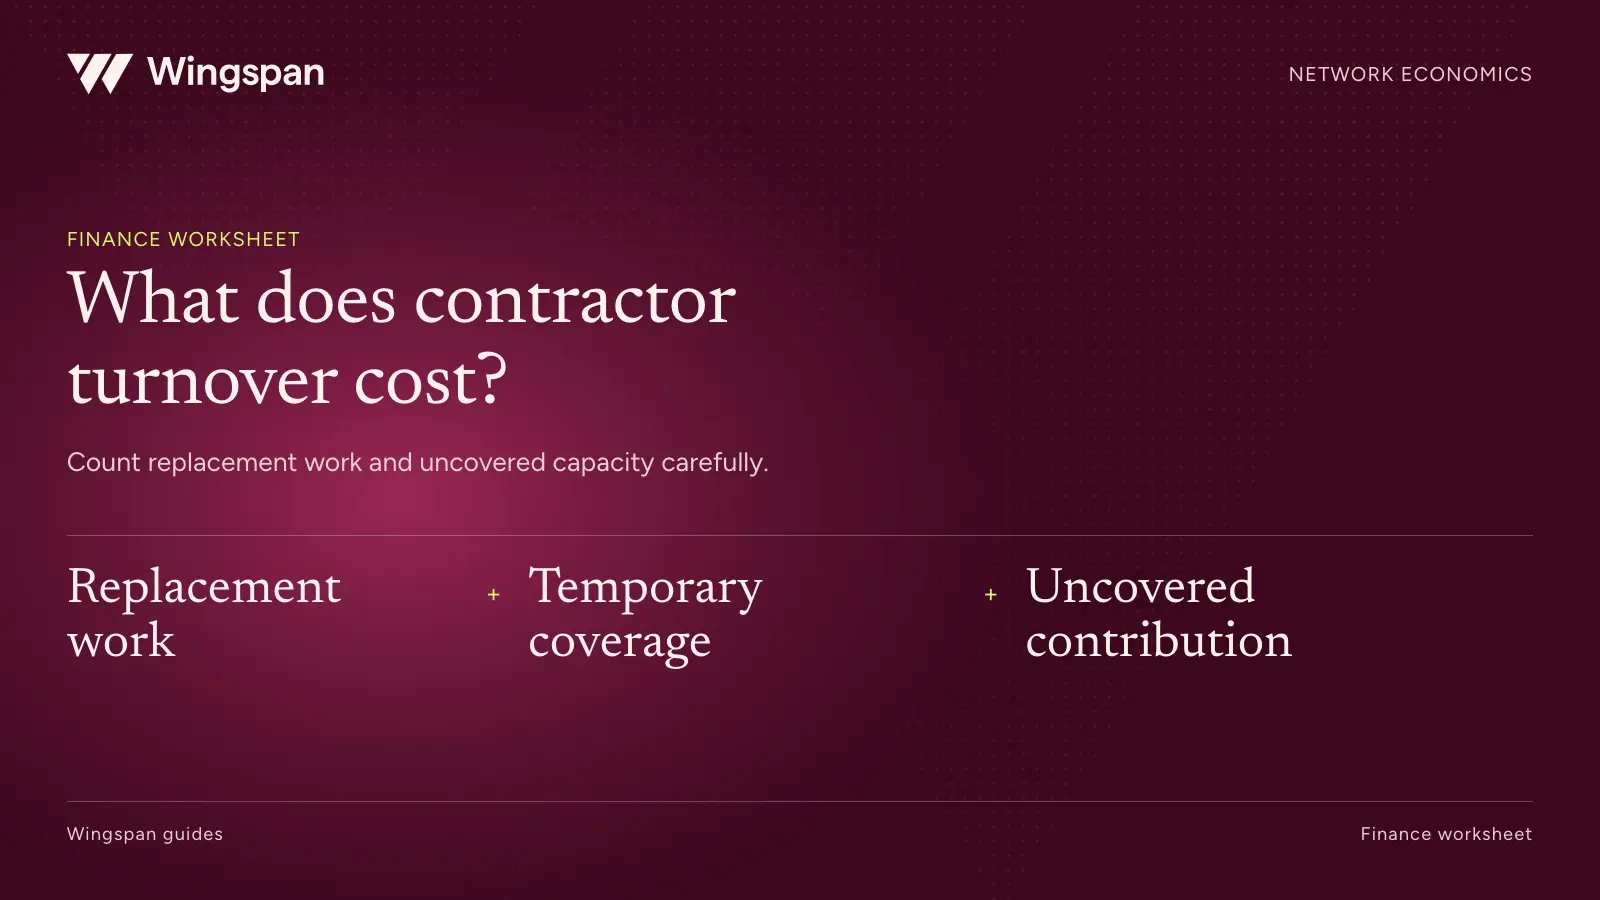
Calculate contractor turnover cost in two parts: the resources you use to replace a departing contractor and the contribution margin you may lose while qualified service capacity is unavailable. Keep the parts separate. You can trace recruitment spend to invoices. Estimating work that might have been completed takes assumptions about demand, coverage, timing, and margin.
This guide is for companies that directly pay large networks of independent contractors to deliver services. It provides a management decision model, not an accounting entry or an employee turnover benchmark. Use it to compare retention experiments, recruitment priorities, and capacity investments by market or service line.
Download the replacement-cost template, worked scenarios, and assumption register. Read the worksheet instructions before combining the results.
A contractor who received no payment this month has not necessarily left your network. A seasonal adjuster may be waiting for a deployment. An inspector may be available in a territory where you have no orders. Someone with completed but unpaid work can disappear from a paid-contractor count while still delivering services.
Set an operational definition for each population. A confirmed departure could mean a contractor explicitly ended the relationship, declined future assignments indefinitely, or was formally removed under your approved process. Track inactivity separately until you have enough evidence to classify it.
For a stable cohort, define the departure rate as confirmed departures during the period divided by eligible contractors in that cohort at the start. Keep new joiners out of that denominator and analyze their early departures separately. A rolling network may need an exposure-based measure instead. Document the definition so a growing roster doesn't make retention look better merely by changing the denominator.
Use service date for activity analysis when possible. Payment dates can move with billing cycles and create a false signal of inactivity. Keep the date of last work, date of last offer, availability confirmation, and departure confirmation as separate fields.
The controller needs to know whether a proposed intervention saves cash, releases staff capacity, or protects future contribution. These outcomes have different evidence requirements.
| Component | What belongs in it | What doesn't belong in it |
|---|---|---|
| Incremental replacement spend | Additional sourcing fees, checks, and other costs incurred because replacement is needed | Costs already incurred before the departure or ordinary payments for productive work |
| Internal replacement effort | Staff hours for sourcing, document review, activation, and support at a documented loaded rate | A claim that salaried expense disappears when a few hours are saved |
| Modeled lost contribution | Unserved demand attributable to the capacity gap, multiplied by contribution per unit | All missing gross revenue or demand that another contractor served |
Record cash spend and internal effort on separate rows even when you display a combined replacement estimate. A $500 reduction in staff effort may free capacity without changing payroll. A $500 external fee avoided is a different budget outcome.
If recruitment would have happened anyway for expansion, allocate only the incremental replacement portion. A campaign serving both growth and replacement needs should not be charged in full to each.
Follow several recent replacements from confirmed departure to readiness for the relevant work. Count the staff touch time, external fees, and failed attempts along the way. Waiting seven days for a document is not seven days of employee labor.
Recruitment yield matters. Suppose five candidates enter screening and two become qualified, available replacements. Include the screening effort for all five in the cohort cost, then divide by the two successful replacements. Dividing by the five applicants understates the cost of adding usable capacity.
Choose the end point carefully. An approved profile may still lack availability in the needed geography. For this model, replacement is complete when the network has comparable capacity available for the work you expect to serve. Record onboarding readiness and first completed work as separate milestones so you can see the remaining gap.
Use the software cost worksheet for vendor pricing and ongoing administrative labor. Keep those recurring platform costs outside the replacement model unless an incremental portion is directly relevant to your decision.
Begin with units the departing contractor could reasonably have served during the replacement window. Cap those units at available demand in the same geography, service type, and period. Then remove work completed by others and work deferred without losing its economic value.
For a simple scenario:
Lost units = demand during the gap × share left unserved because of the departure.
Lost contribution = lost units × contribution per completed unit.
Contribution per unit is revenue less the variable costs avoided when the unit is not delivered, including contractor compensation and other relevant delivery costs. Finance should define those costs consistently. Fixed overhead generally remains even when a job is lost.
If replacement coverage uses a higher rate, record only its incremental premium for covered units. Don't also classify those same units as lost. Any service credits or contractual penalties belong in separate evidence-backed rows, with a check against overlap in the margin estimate.
The following figures are illustrative, not customer results. One confirmed departure requires $300 in external replacement spend and 12 internal hours at $40 per hour. The combined replacement resource estimate is $780, including $480 of internal effort.
During the three-week gap, 60 inspection opportunities are expected in the relevant territory. At $50 of contribution per inspection, the capacity effect depends on how much work other qualified inspectors can cover.
| Scenario | Demand during gap | Unserved share | Lost units | Modeled lost contribution | Replacement resources plus lost contribution |
|---|---|---|---|---|---|
| Strong coverage | 60 | 20% | 12 | $600 | $1,380 |
| Base assumption | 60 | 40% | 24 | $1,200 | $1,980 |
| Limited coverage | 60 | 70% | 42 | $2,100 | $2,880 |
The last column is a decision estimate, not a booked expense or guaranteed savings. All three scenarios share the same $300 cash spend and $480 internal effort. The difference comes from the assumed coverage gap.
If only 30 jobs would have been available, the base case loses 12 units and $600 of contribution. If other contractors complete every job at the usual rate, the modeled lost contribution is zero. The departure still consumes replacement resources.
This sensitivity tells the COO what to investigate next: actual local demand and substitute capacity. Refining a small recruitment fee matters less if the coverage assumption drives most of the range.
Suppose a retention experiment costs $12,000 over a quarter. Using the illustrative base case, $12,000 divided by $1,980 is about 6.1 departures. Under those assumptions, the experiment would need to prevent at least seven comparable departures to exceed its cost on the combined resource-and-contribution measure.
That is not the cash break-even point. Seven avoided departures would avoid only $2,100 of the modeled external replacement spend. The rest is staff capacity and opportunity value. Present those components separately to finance.
Measure the experiment in comparable cohorts and record changes in demand, rates, geography, tenure, and service mix. A quieter season can reduce departures and unfilled work without proving that your intervention caused either change. Exit interviews and payment-support records can suggest hypotheses. They don't establish that payment friction caused every departure.
A repeat payment demonstrates repeat paid activity. It doesn't establish a contractor's future availability or prove that a platform prevented turnover. In the DeliverThat customer story, the company describes giving drivers access to their information and invoices within its driver app and reducing payment administration. Use those operating changes to identify what to measure in your own network.
If contractors report difficulty understanding payment status, evaluate that specific problem using the self-service portal requirements checklist. Track whether the intervention reduces the reported problem before assigning it a retention benefit.
We connect onboarding, payments, and worker support for growing contractor networks. Bring one territory's departure definition, replacement steps, and payment-support evidence to a Wingspan workflow demo. We can walk through the administrative steps with your team so you can test proposed changes in your cost model.
Forecast the internal team capacity required for contractor onboarding, payment exceptions, support, and tax readiness across normal, peak, and growth scenarios.

Diagnose contractor onboarding drop-off with consistent cohorts, stage definitions, waiting-time measures, and experiments that separate friction from no work.
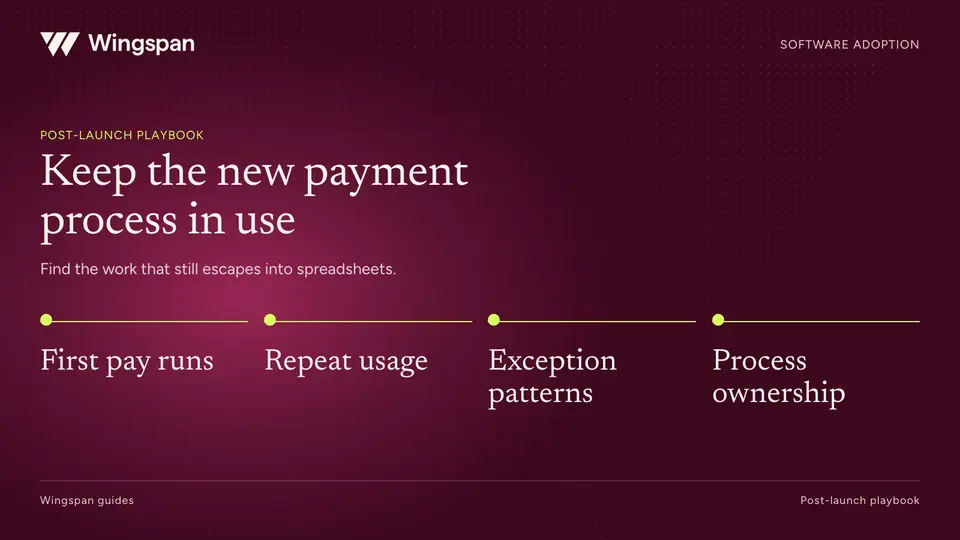
A post-launch operating plan for identifying payment workarounds, measuring approved-route adherence, and improving recurring workflows over 30, 60, and 90 days.